The first, most important step in Data Science to make future predictions better
- Elie L
- Jun 24, 2021
- 3 min read
Updated: Mar 20

RMS Titanic was a British passenger liner that sank in the North Atlantic Ocean, after it collided with an iceberg during her maiden voyage from Southampton to New York City. It was, one of the deadliest commercial peacetime maritime disasters in modern history.

An unknown Titanic crew member is reported to have once said to embarking passenger, Mrs. Sylvia Caldwell, “God himself could not sink this ship!”
The R.M.S. Titanic was the largest and most luxurious passenger ship of its time. Engineers, electricians, plumbers, painters, master mechanics, and interior designers fit Titanic with the latest in marine technology, and the most extravagant fixtures and furniture. Once finished, Titanic’s size and technological advancements were primary reasons why it was believed to be a practically unsinkable ship in the publics estimation.
Kaggle is a platform for predictive modeling competitions. They provide a “Getting Started” competition to gain a first experience in Data Science with Titanic Kaggle. This was a great opportunity for me to become a better Analyst (a future Data Scientist ?). The challenge is about predicting survival on the Titanic.
On April 15, 1912, the Titanic sank after colliding with an iceberg, killing 1502 out of 2224 passengers and crew. One of the reasons that the shipwreck led to such loss of life was that there were not enough lifeboats for everyone. Let’s find out what sorts of people were more likely to survive.
In this post, I will show you how I used python and sci-kit learn to explore the problem. This is an important first step to make future predictions better. I will show, how to run predictions of, who survives the Titanic thanks to Python.
The Kaggle website provides us with a dataset to train our analysis containing a collection of parameters for 891 passengers (download the train.csv, test.csv )
Notebook
Now lets import the Libraries from sci-kit learn.

After importing packages, will load the “Train” and “Test” data set from Kaggle website.

Data Dictionary
Before doing any prediction, one has to clean and shaped the data as per requirement, the first step in machine learning is to check for features.

In machine learning the accuracy outcome depends on feature relationships, for example in this dataset our goal was to predict Survival of passengers. Fare, cabin has little to contribute in our mission here.
Hence, will opt to drop them alllll…….

The data wrangling with datasets called feature engineering, prediction outcome depends on fine tunning and determining feature relationships. After dropping bulky stuffs, next comes the encoding.
Sci-kit accepts the numeric value only, so in next task will check for non numeric values in datasets. One hot encoding is the favorite among data scientist for converting categorical variables to numeric.

The machine learning divided in two, supervised and unsupervised one, this particular dataset will use supervised learning. There are different algorithm, available for fitting data in our Titanic model, before fitting any algorithm first we need to split the data.

Train dataset has to split before predicting on test set. In sci-kit learn we can choose model algorithm with hyper parameter, for better control over algorithm. The “test_size” in above code decides the splitting percentage of dataset among “test” and “train” data set.

Cross validation is the process of training learners using one set of data and testing it using a different set. Parameter tuning is the process to selecting the values for a model’s parameters, that maximize the accuracy of the model. Grid search is a model hyper parameter optimization technique. In Scikit-learn this technique is provided in the GridSearchCVclass.
After cross validation and hyper parameters tunning our model is ready to fit, here we used RandomForestClassifier as base model.


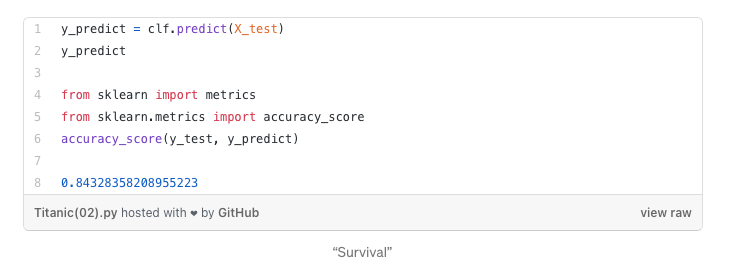
Prediction need to be done on test set, after fitting and all tunning stuff, our model is ready to compare. Accuracy metrics takes parameter as given test dataset and predicted one, And finally our prediction shows 84% accuracy. “Well, not bad for rookie I think...”


